You’ve done everything right.
You cleaned up your diet, followed your supplement plan, and stayed consistent month after month. You’ve done repeat HTMA testing — trusting that each retest would show you moving forward.
And yet.
The results don’t cooperate. Some ratios improve, then drop back. Others stay out of range year after year. A test that looked promising last time suddenly looks worse. And somewhere along the way, the question becomes unavoidable:
Why aren’t my HTMA results improving?
If that’s where you are, you’re not alone — and you’re not failing the programme.
Most people who ask this question are actually doing everything right. What’s missing isn’t effort. It’s a framework for understanding what HTMA retests are actually measuring — and why the gap between how you feel and what your hair tissue mineral analysis shows is not only common, it’s clinically meaningful. Sometimes it’s even a sign that things are moving in exactly the right direction.
In This Article
- Why HTMA retest results don’t improve in a straight line
- A real HTMA case study: 3.5 years of retest data
- Feeling better — but the chart doesn’t show it
- What longitudinal HTMA pattern analysis actually shows
- Why your HTMA retest results don’t match how you feel
- Why HTMA retest results sometimes look worse before they improve
- How to interpret your HTMA retest results
- How long does HTMA progress actually take?
- What real HTMA progress looks like
- When your HTMA retest results look confusing
- Understand Your Own HTMA Retest Results
- Frequently asked questions
Why HTMA Retest Results Don’t Improve in a Straight Line
Most people begin HTMA with the same assumption: the goal is to achieve ideal mineral levels and ratios, and each retest should show progress toward that target. Follow the programme, take the supplements, retest in four months — and the numbers should move in the right direction.
It’s a logical way to think about it. The problem is that the body doesn’t heal that way — and this assumption sets up a kind of confusion that is almost guaranteed to follow.
Progress in HTMA is not a march toward ideal numbers. It is a process of uncovering and resolving layers of imbalance, in sequence, over time. Some of those layers will look worse before they look better. Some ratios will move away from targets before they move toward them. And reaching what appears to be an ideal pattern at one point does not mean the work is done — deeper layers may still be waiting.
The body doesn’t work that way.
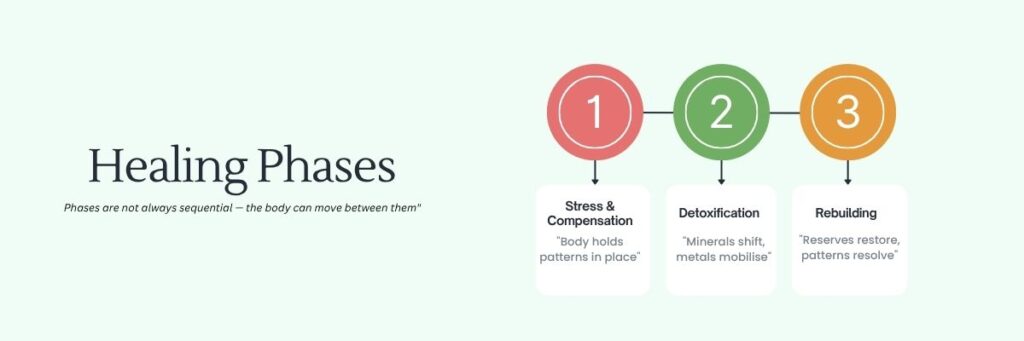
Healing through nutritional balancing happens in phases: stabilisation, compensation, detoxification, and rebuilding. These phases don’t always appear in sequence, and not all of them look like improvement on paper — even when they represent exactly that.
A properly designed nutritional balancing program slowly uncovers and unwinds deeper and deeper layers of biochemical imbalance. This is a critical concept. What appears on a retest is not simply a measure of whether you’ve improved — it is a window into which layer the body is currently working through. A retest that looks worse than the last one may not be a setback. It may be the body revealing something that was previously hidden.
HTMA is a tissue mineral test. It reflects completed biochemistry — the mineral environment in your hair over the past three to four months. This matters more than most people realise: by the time a test is run, you’re looking at a biological record of where your body was, not where it is right now. If you’ve recently begun shifting — through supplements, lifestyle changes, or nervous system regulation — that shift may not yet be visible in the tissue data.
You can feel better before your chart reflects it. That delay is not a flaw in the method. It’s biology.
A Real HTMA Case Study: 3.5 Years of Retest Data
One of my clients — an engineer by background, which shapes how he approaches data — carefully tracked his HTMA results across seven tests over three and a half years. He followed his supplement protocol consistently, maintained a clean diet and structured lifestyle, and documented everything.
He did the work. And when we reviewed the data together, he was frustrated.
What he saw was:
- Mineral ratios remaining outside optimal ranges across multiple tests
- Fluctuations rather than clear directional movement
- Toxic metals declining, then rising again
From where he was sitting, it looked like very little had changed in three and a half years.
But his symptoms told a completely different story.
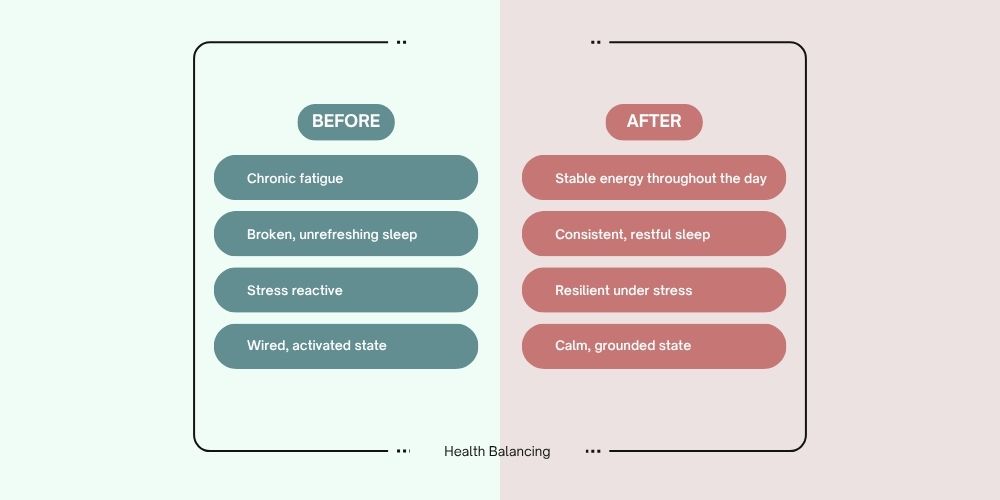
Feeling Better — But the Chart Doesn’t Show It
Over that same period, his day-to-day experience had changed significantly:
- More stable energy throughout the day
- Better, more consistent sleep
- Greater resilience under stress
- A fundamentally different internal state
He described moving away from a chronic state of high activation — the kind of wired, driven energy that many people don’t even recognise as stress until it starts to ease — toward something calmer, quieter, and more grounded.
For someone who had spent decades running on a sympathetic-dominant stress response, that shift in baseline is not a small thing. It represents a real neurological and physiological transition.
So why didn’t the chart show it?
This is one of the most important questions in long-term HTMA practice — and it has a real, satisfying answer.
What Longitudinal HTMA Pattern Analysis Actually Shows
This is where HTMA gets genuinely interesting — and where most people are missing the most important layer of information in their own results.
Rather than focusing on individual mineral numbers, longitudinal HTMA analysis becomes far more meaningful when you map patterns across tests. Each pattern is a named configuration that tells a specific story about what the body is doing. Some signal stress and depletion. Others signal active healing. And some that look alarming are, in context, among the most positive signs in the entire dataset.
The grid below tracks 25 recognised HTMA patterns across all seven tests. Each row is a pattern; each column is a test date. A grey dot means the pattern was active at that test. A yellow dot means it appeared as a positive retest — a healing response. The Count column on the right shows how many of the seven tests each pattern appeared in, making persistence visible at a glance. Patterns are grouped into five categories: Adrenal/Stress, Mineral, Burnout/Fatigue, Toxicity, and Healing — so you can see at once where the body’s load has been concentrated, and where positive movement is beginning to emerge.
Several things stand out when reading this data correctly.
The persistent patterns are not a sign of stagnation. Burnout pattern present in all seven tests. Copper imbalance in all seven. Deep Stress Imprint in six. These patterns reflect the depth of the original imbalance — not a lack of response to the program. A body this deeply depleted does not resolve in one or two years.
The positive retest patterns tell a different story. This is where the real clinical information lives, and it is frequently overlooked.
- Gathering Firewood appeared in three tests. This pattern is associated with a decrease in phosphorus on a retest — which can look concerning but is typically a sign of active toxic metal elimination. Lead and mercury in particular can displace phosphorus upward, artificially inflating its reading. As these metals are cleared, phosphorus drops to where it should actually be. In some cases, the metals temporarily interfere with biosynthesis as they exit, producing a similar dip. Either way, the pattern indicates the body is in an active elimination phase — consolidating and preparing for deeper healing, not regressing.
- Elimination of Bio-unavailable Calcium appeared in the last two consecutive tests (July and December 2025). This is significant. Bio-unavailable calcium — often called a calcium shell — is not the same as dietary calcium doing its job. It exists in the tissues in unusable forms, typically as an oxide or carbonate, and rather than supporting cellular function it becomes a burden: narrowing arteries, depositing in joints, kidneys, and brain, and acting as a buffer that masks deeper metabolic imbalances. When the body finally begins to clear it, the chart may look more volatile — but the process represents a meaningful step toward genuine resolution, and signals that calcium metabolism is beginning to normalise. This pattern typically does not appear until the body has stabilised sufficiently to tolerate the release. Seeing it in consecutive tests, after two and a half years of groundwork, is one of the more significant signals in this client’s longitudinal data.
- Settling Down appeared twice. This pattern occurs when the macrominerals — calcium, magnesium, sodium, and potassium — decrease together on a retest. Rather than indicating depletion, it reflects a relaxation of the system: the body settling in for the longer work ahead, becoming more stable rather than reactive. It often accompanies active elimination of the amigos (iron, manganese, aluminium, nickel, chromium) or other toxic metals such as copper or cadmium. It is considered a strongly positive health indicator.
The September 2023 test was notably active — a cluster of positive retest patterns, including Everything Coming Out, indicating a broad elimination phase across multiple systems. This was a significant healing moment in the longitudinal sequence, even though the surface-level numbers may not have looked dramatically different.
The Everything Coming Out pattern in particular is worth understanding. It indicates a broad increase in the body’s elimination of six or more toxic minerals simultaneously — and typically also signals the clearance of toxic chemicals, not just metals. Many of the mineral compounds that accumulate in the body before beginning a development programme are toxic or degraded forms, the result of compromised food quality and environmental contamination. When this pattern appears, it reflects an overall increase in the body’s capacity to clear poisons of multiple types at once. Seeing it cluster with other positive retest patterns in the same test reinforces that September 2023 represented a genuine turning point in the elimination process.
Why Your HTMA Retest Results Don’t Match How You Feel
The gap between how you feel and what your chart shows is one of the most common sources of confusion in long-term HTMA work — and it runs in both directions. Some people feel significantly better while their results look worse. Others see improved markers while their symptoms haven’t shifted. Both situations are real, both are well-documented, and neither means the programme isn’t working.
Your mineral levels are a record of adaptation, not just health
Understanding why requires understanding how the body adapts.
The body is remarkably good at surviving — and it does so by compensating. At any given moment, your mineral levels and ratios are not simply a measure of your health. They are a record of how your body has been adapting to its load: its stressors, its toxic burden, its energy reserves. These adaptations shift constantly. A very slow oxidation rate, for example, looks like low energy and low mood on a chart — but it may be the best the body can manage right now. A high toxic metal burden produces its own distinct mineral signature. As each of these states begins to shift, the picture changes — and sometimes that change looks, on paper, like things are getting worse.
Symptoms and lab data move on different timelines
This is why symptoms and lab results do not always move together. In some cases, the felt experience changes before the tissue data catches up. In others, the body chemistry shifts first — correcting something latent or sub-clinical — while noticeable symptoms remain unchanged for now. Both are normal.
Progress is easier to see when you track it from the start
There is also something that happens quietly over time: people forget how they used to feel. The afternoon crashes that have stopped happening. The anxiety that used to spike for no reason. The sleep that is now, without any fanfare, simply better. These things become the new normal so gradually that they are no longer felt as improvements — they are just life now. Keeping a written record of your original symptoms at the start of the programme is one of the most valuable things you can do. It is more common than most people expect to look back at that list six months later and realise that half of what was once debilitating has simply gone.
Copper dysregulation adds another layer of complexity
This client showed a copper imbalance pattern in every single test — all seven. Copper dysregulation is significant because copper affects neurological function, energy metabolism, and mood regulation in ways that can diverge sharply from what tissue mineral levels show.
Copper that is present in tissue but not bioavailable — often associated with low ceruloplasmin — can produce symptoms that fluctuate independently of what the HTMA chart shows. Feeling better neurologically and emotionally does not necessarily mean copper is resolved. Resolving copper imbalance is a slow, layered process — and in someone with sympathetic dominance running concurrently, it takes longer still.
There is also a subtler dynamic at play that experienced practitioners recognise: copper can prop up mineral ratios. When copper is dysregulated and sequestered in tissue, it can temporarily hold certain ratios in a range that appears relatively stable — or even looks like progress. Then, when the body finally begins to release that copper, the ratios shift again. What looks like regression is actually the system clearing something it had been compensating around for years.
A practitioner with many years in nutritional balancing described this directly: around the four-year mark, their own results showed what looked like perfect ratios and levels. They assumed they were done. Then a significant copper dump followed — and things moved in different directions again as the copper that had been holding the picture in place was finally released. It is one of the most instructive examples of why HTMA cannot be read in isolation from the full longitudinal sequence, and why “looking good on paper” at any single point in time is never the whole story.
Sequestered metals skew ratios — sometimes for years
Toxic metals that have accumulated in the body over time are frequently sequestered — stored in tissue rather than circulating. In that sequestered state, they influence mineral ratios in ways that are not immediately visible on the chart. The ratios can appear to stagnate, drift, or fail to reach targets not because the program isn’t working, but because the metals distorting them have not yet been mobilised.
This is a critical point that is easy to miss when looking at any single ratio in isolation. You cannot read one ratio, compare it to target, and draw a conclusion about whether progress is occurring. You need to look at what has been shifting across the full retest sequence — which patterns are appearing, which are resolving, and where the body’s energy is currently directed.
Why HTMA Retest Results Sometimes Look Worse Before They Improve
When detoxification or deeper mineral elimination begins, charts can become temporarily more volatile. New imbalances may appear. Ratios that had been stable can shift. Toxic metals can rise as they mobilise from tissue storage before being excreted.
This is not regression. It is the body revealing the next layer — and it is one of the most commonly misread situations in HTMA practice.
There are several distinct mechanisms behind this, each worth understanding.
Decompensation. After months on a nutritional programme, energy improves and the body no longer needs to compensate as heavily. A change in equilibrium occurs. Temporarily, this can produce an apparent worsening of certain markers — not because things are getting worse, but because the body is no longer holding the old compensations in place.
Mineral retention and displacement. A mineral that appears to drop on a retest is not necessarily becoming more deficient. Zinc, for example, can appear to fall precipitously while the person feels noticeably better. What is often happening is that a toxic metal such as cadmium — which can displace zinc and artificially elevate its tissue reading — is being eliminated. As cadmium clears, zinc is retained in the tissues for active repair rather than excreted into the hair. The chart shows less zinc; the body is actually using more of it. This is called zinc retention, and it is a normal part of the healing process.
The oxidation rate can worsen as toxic metals clear. Some clients present with a relatively balanced oxidation rate on their early tests — not because their body chemistry is genuinely balanced, but because accumulated toxic metals are artificially propping it up. Cadmium, for example, raises sodium. Lead can substitute for calcium. As these metals are eliminated and replaced by physiological minerals, the underlying imbalance becomes visible. The chart looks worse. The person often feels better. Both things are true simultaneously.
Uncovering a deeper layer. This is perhaps the most important concept in retest interpretation. Imbalances in body chemistry are unwound layer by layer. A superficial layer may not appear dramatically abnormal. The deeper layer beneath it — revealed only once the first has begun to resolve — can look considerably more imbalanced. This is not cause for alarm. It is cause for recognition that the process is moving forward.
This exact situation came up with this client at the July 2025 retest. Almost every marker in the first four minerals had worsened. His first instinct — entirely reasonable — was to question whether the sample was faulty and whether the test needed to be rerun.
It didn’t. What the chart was showing was a significant aluminium dump: the body actively clearing stored metals from tissue. Nutrient minerals had dropped not because they were depleted, but because they were being retained and redirected into tissue repair — filling the spaces vacated by exiting toxic metals. The first four minerals were showing signs of decompensation as the body moved into a deeper phase of detox and recovery.
To someone looking only at the numbers, it looked like the worst test in years. Clinically, it was one of the most significant healing moments in the entire sequence.
This is why individual test results can be genuinely misleading without longitudinal context. A single chart cannot tell you whether a worsening result is a problem or a milestone. Only the sequence can.
A note on averaging. There is one further reason retests can appear static even when meaningful change is occurring. Hair analysis captures an average of the mineral environment over the sampling period — typically three months. A mineral that rises sharply and then falls sharply within that window will average to a reading similar to where it started. The change happened; the test doesn’t show it. This is one reason why retesting more frequently — every three to four months rather than every six — can provide a clearer picture during active healing phases.
How to Interpret Your HTMA Retest Results
It’s easy to arrive at a reasonable-sounding conclusion: if I feel better but the data doesn’t show it, the test must not be very useful.
But that assumption misunderstands what testing is for.
HTMA retesting is not designed to confirm how you feel. It’s designed to show what your body is doing — including things you cannot feel yet. There are more reasons to retest than most people realise, and feeling better is not a reason to stop.
Why HTMA retesting matters — even when you feel well
Safety. Retesting is the primary way to confirm that a healing programme is actually improving health rather than inadvertently creating new imbalances. The wrong supplements — taken in the wrong phase — can set a person back rather than forward. Retesting is what ensures the programme remains appropriate.
Maintaining vitality. When a programme is properly matched to current body chemistry, vitality increases significantly. That level of energy is necessary for deep healing to continue. Retesting regularly is the only way to assess whether the programme is still optimised for this — or whether it needs adjusting.
Responding to life changes. Body chemistry does not exist in isolation. A new job, a move, a period of acute stress, an illness — all of these affect mineral levels and ratios. Retesting allows the programme to account for what is happening in a person’s life, not just what was happening when they last tested.
Explaining puzzling symptoms. Fatigue, pain, low blood sugar, mood changes — many of these have a biochemical explanation that is only visible at the cellular level. A retest can reveal what is driving a symptom that otherwise makes no sense, and point toward what needs to change.
Addressing latent and sub-clinical conditions. Most people carry health imbalances that are not yet overt — old chronic patterns, early-stage tissue issues, conditions that do not show up on standard blood tests but are present nonetheless. A nutritional balancing programme is one of the few approaches that can begin to address these layers. Often, the only evidence that this correction is occurring is a significant shift on a retest.
Cost-effectiveness. Remaining on a programme that no longer matches your body chemistry is a waste of both money and effort. Retesting is what keeps the supplement protocol lean, targeted, and appropriate to where you actually are.
Look for patterns, not just numbers
Single test results can mislead. A mineral that appears low may be low for entirely different reasons depending on what else is happening in the chart — and a ratio that looks worse than last time may be moving in exactly the right direction.
Each retest answers questions that symptom-tracking alone cannot: what phase is the body currently in, what has shifted since last time, and what does it need next. Pattern analysis across multiple tests reveals things no single snapshot can. This is where HTMA becomes genuinely powerful — and why the pattern grid matters more than any individual number.
Identify which phase the body is in
The body moves through recognisable phases in nutritional balancing:
Stress and compensation — the body is managing its load, holding patterns in place, maintaining function. Markers may appear stable, but stability here is not the same as resolution.
Detoxification — minerals shift, toxic metals mobilise, ratios become volatile. Charts can look worse. This is often progress, not regression.
Rebuilding — the body begins restoring depleted mineral reserves and re-establishing normal metabolic function. Patterns gradually begin to resolve.
These phases are not always sequential, and the body can move between them. Retesting is what tells you which phase is active — so support can be adjusted to match.
Adjust the protocol accordingly
This is why retesting drives programme changes, not just reassurance. The same supplement that is appropriate in one phase can be counterproductive in another.
A low sodium-to-potassium ratio, for example, indicates a specific kind of depletion and calls for rebuilding support such as Limcomin. A higher Na/K ratio signals a different stress response pattern and may call for zinc instead. Without retesting, you cannot know which is true — and continuing the same protocol regardless is not precision nutrition. It’s guesswork.
This responsiveness matters in practice. Following the July 2025 test — where decompensation patterns were active and the body was in a heavy detox phase — the protocol was adjusted immediately. Key supplements were paused for a short period to observe how the body responded without them, and to assess whether a slower, more gradual approach was needed at that stage. That kind of adjustment is only possible when retesting is providing current information.
How Long Does HTMA Progress Actually Take?
This is the question that deserves an honest answer.
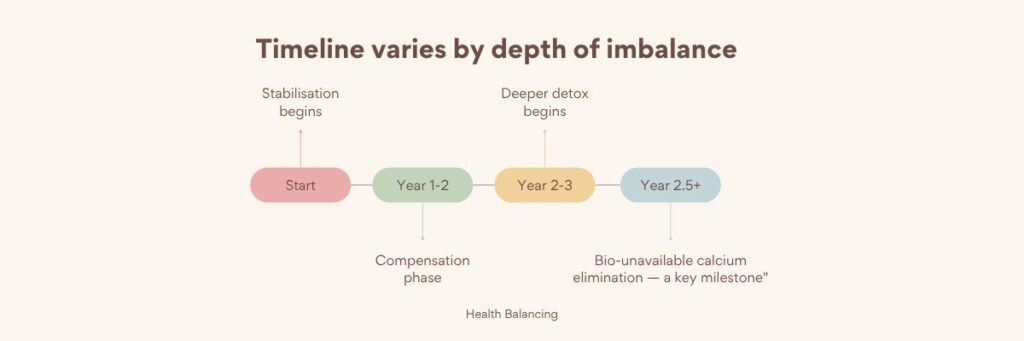
HTMA nutritional balancing is not a short-term protocol. For clients presenting with sympathetic dominance, heavy metal burden, and copper dysregulation — which describes many of the people drawn to this work — visible progress in the lab data typically takes longer than most expect.
Early phases involve stabilisation and compensation. Deeper detox often begins in the second or third year. In this case, it took approximately two and a half years before deeper detox began — before the Elimination of Bio-unavailable Calcium pattern appeared and the body started moving through a genuinely new layer.
That is not unusual. It is the expected timeline for this depth of imbalance.
This is not a limitation of the method. It is a reflection of how long the original imbalances took to develop. Healing of this kind moves in the same direction — slowly, in layers, over years.
What Real HTMA Progress Looks Like
Progress in long-term HTMA work is not:
❌ Perfect numbers
❌ Steady improvement test by test
❌ A chart that validates how you feel month by month
Real progress looks like:
✅ Shifting patterns over time, read as a sequence
✅ Positive retest patterns appearing — even intermittently
✅ Deeper layers emerging as earlier ones begin to resolve
✅ The body responding — less reactive, more grounded, more stable
✅ The felt experience changing, even before the chart catches up
When a client feels genuinely better — calmer, sleeping more deeply, less triggered by stress — and the chart does not yet clearly reflect it, that is not a contradiction. It is a lag. And in many cases, it is exactly where they should be at this point in the process.
When Your HTMA Retest Results Look Confusing
If your HTMA retests are fluctuating, not moving linearly, or not matching how you feel — the single most useful thing you can do is stop looking at individual tests and start reading the sequence.
A single test is a snapshot. A series of tests is a story — and that story contains far more information than any one result could hold.
The client whose data runs through this article did three and a half years of consistent work. His chart, at any given point, may not have looked like progress. But read as a complete sequence, it tells the story of a body systematically working through layers of deep, long-standing imbalance — clearing metals, releasing stored calcium, stabilising, and beginning to rebuild.
That is not a story of stagnation. That is a story of healing. And it is only visible when you know how to read it.
Understand Your Own HTMA Retest Results
Your HTMA results contain more information than most people realise — including information about what your body is currently doing, which phase it is in, and what it needs next. That information doesn’t live in any single number. It lives in the pattern of change across multiple tests, read by someone who knows what to look for.
If you’re ready to understand what your own mineral patterns are telling you — not just whether your numbers are in range, but what the sequence of changes actually means — a Hair Tissue Mineral Analysis with pattern-level interpretation is where that clarity begins.
Frequently Asked Questions
Because healing happens in phases, and different phases produce different mineral signatures. Detoxification phases, stabilisation phases, and rebuilding phases all look different on a chart — and none of them are guaranteed to look like straightforward improvement.
It depends entirely on the depth of the original imbalance — and that depth is often greater than it appears on the first test. For clients carrying significant sympathetic dominance, heavy metal burden, and copper dysregulation, the early phases of the programme are largely about stabilisation. Meaningful pattern shifts emerge gradually, and full resolution is a longer process still. The body heals at the pace the imbalance accumulated — which for most people was years, sometimes decades, in the making.
Because mineral levels and ratios are not simply a snapshot of your health — they reflect how your body has been adapting and compensating. Symptoms and lab data move on different timelines. In some cases the felt experience shifts first; in others the body chemistry corrects a deeper imbalance before the more obvious symptoms change. Both are normal and well-documented in long-term HTMA practice.
Positive retest patterns are specific mineral configurations that indicate the body is actively healing — consolidating reserves, releasing stored toxins or bio-unavailable minerals, or moving through a detox phase. They appear intermittently and are easy to miss if you’re only looking at whether numbers moved toward targets.
Yes. When the body mobilises stored metals for excretion, they temporarily increase in tissue concentration before being eliminated. A rise in mercury or aluminium on a retest, in the context of other positive indicators, is often a sign that detoxification is underway — not that the situation is worsening.
It can indicate that the body has entered a deeper detox or decompensation phase — particularly when toxic metals are being actively eliminated. Nutrient minerals are sometimes redirected into tissue repair during this process, which causes them to appear lower on the chart. This pattern requires careful interpretation in context: it can look alarming in isolation, but within a longer sequence it is often a sign of meaningful metabolic activity.
Several reasons. The most common is a healing or retracing reaction — the body correcting a deeper imbalance that may not be your most obvious symptom, meaning you don’t notice the improvement directly. It is also worth considering that people often forget how they felt at the start of the programme. Symptoms that have resolved quietly — better sleep, fewer crashes, less anxiety — can be taken for granted. Keeping a written record of your original complaints makes these changes visible over time.